The MAHA Report: Doing Our Own Research
Part III of Reading the MAHA Report so You Don't Have to
RECAP: On Feb 13 2025, President Trump issued an Executive Order to create the Make America Healthy Again Commission, and directed them report on the “childhood chronic disease crisis”. The Commission was given 100 days and on May 22, their MAHA Report was released to the public.
Which is why I’m reading the MAHA Report; so you don’t have to.1 You can find Part I here; and Part II here. This is Part III. Enjoy!
P.S. Don’t forget to Subscribe so you don’t miss out on Part IV.
Today’s MAHA Report read-through is going to be a bit different. Instead of fact checking the report item by item, which would be kinda tedious, I thought it would be more interesting to do our own research.
I covered the obesity data yesterday, so I’m going to start today with diabetes.
Diabetes is Increasing among American Youth
The report claims type 1 and type 2 diabetes are both increasing in American children. Let’s find out how much.
Step 1: If I’m looking for basic public health information, like the trends in diabetes incidence (i.e., new diagnoses) or prevalence (i.e., total diagnoses) over time, my first step is good old Google. And, if we ignore the AI slop that now shows up on every Google search, we can see that the first two results for “diabetes trends US children” are a scientific article (pmc.ncbi.nlm.nih.gov is PubMed which archives published, peer-reviewed biomedical scientific research), and a CDC report.
The CDC report is likely going to give us a somewhat pre-digested reading of the evidence which is actually what we want, so that’s my first stop.
Step 2: What does the CDC say about childhood diabetes?
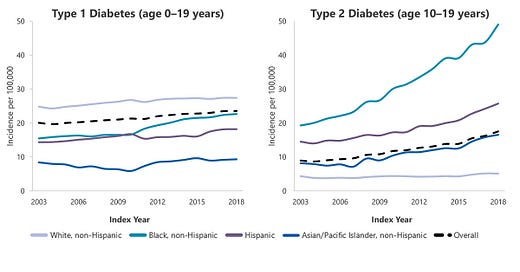
The National Diabetes Statistics Report turns out to cover diabetes in all age groups, so we have to scroll down quite a ways to find any information about children, but what we learn is that diabetes rates are rising. Particularly for Type 2 diabetes, and particularly in Black, non-Hispanic youth.
In fact, Type 1 diabetes doesn’t seem to be changing all that much over time, and Type 2 diabetes in white non-Hispanic youth is also pretty flat over time. So, yes, diabetes in children is a real problem but it’s a nuanced one.

But can we trust the CDC data? Look, I’m not about blindly trusting the government, or anyone else for that matter. After all, this whole series you’re reading is about fact-checking a government report! But we can trust this CDC data.
How do I know? Because all the details we need to assess it are available for us to do just that.
Right below the graph, we’re directed to the source: a peer-reviewed publication by Wagenknecht et al in 2023. This paper reports on the SEARCH for Diabetes in Youth study results for diabetes incidence in children. It is, in fact, a companion paper to the one Google found for us in our original search; that one looked at prevalence. These two papers give us lots of detail about how the SEARCH Study was conducted, and, if you read them, you’ll see that the CDC report is summarizing the findings of this paper. So, while peer-reviewed papers can be wrong, it’s reasonable to conclude that the incidence graph the CDC reported is the best available information on diabetes in US children. I trust it.
What did the MAHA Report say? The MAHA Report actually has quite a lot to say about diabetes in kids, and cites 7 different sources (including the same National Diabetes Statistics Report that we found!).
But instead of showing the clear and, honestly quite alarming, graph about Type 2 diabetes rates in kids that the CDC report provides, they chose to show a graph of the prevalence of pre-diabetes, and to focus their factoids on predictive modeling of potential diabetes rates in kids in 2060.
And yes, sure, we should try to prevent kids who don’t have diabetes from developing diabetes, but the data clearly show a massive problem RIGHT NOW with diabetes in kids. And if we’re trying to tackle children’s chronic health, it seems to me like addressing the issue of kids who CURRENTLY have diabetes is maybe a bit more important than the hypothetical rates of diabetes of kids who won’t be born for another 25 years. Doesn’t it?
Rates of Neurodevelopmental Disorders are Increasing
This is one of RFK Jr’s personal interests, and I’ve written at length before about some of the data issues here. So I’m not going to go into this item, much, except to note that the Report actually does use an okay graph to illustrate this problem.
The graph shows the prevalence of autism in 8 year olds from 2000 to 2022, as identified by the CDC’s Autism and Developmental Disabilities Monitoring (ADDM) Network, and there is a steady increase.
But if you go to the ADDM page, you can see that they also prevent data from several other sources, including Medicaid, which show somewhat less compelling increases. Moreover, the ADDM page discusses methodological challenges with evaluating trends over time because of changes in diagnoses and data collection methods. This one is just not that clear cut.
Childhood Cancer Incidence has Risen Dramatically
The MAHA report has only one thing to say here about childhood cancer rates: “childhood cancer incidence has risen over 40% since 1975”.
This is accompanied by a graph of what is, presumably, cancer incidence rates (the label just says ‘cancer rates’, so it could be prevalence). Both the graph and the statement are cited as coming from the National Cancer Institute SEER-8 Registries, and SEER (the Surveillance, Epidemiology, and End Results Program) is a reasonable place to start when looking for basic cancer facts.
So let’s start there too: https://seer.cancer.gov/
If you click on the Cancer Statistics Explorer Network link, which is right near the top of the page, you immediately see that there are two separate resources to consult. One, SEER*Explorer provides overall cancer data (children and adults); and the other, NCCR*Explorer gives us cancer statistics on children, adolescents, and young adults. Let’s look at that one.
The NCCR*Explorer lets us select a time range starting in 2001 and age ranges either in years or age groups; I picked <20 years of age. This is the graph.

There are two things worth noticing here. First, the y-axis is in rates per million, whereas the Report shows rates per 100,000. That’s why the numeric y-axis values are larger here than in the Report.
Second, the y-axis starts at zero here, whereas in the report it starts at 10 per 100,000 (or 100 per million). Starting the y-axis at zero is generally seen as a more objective way to look at trends in incidence over time.
On the other hand, our graph only goes back to 2001, not all the way back to 1975 like the one in the Report.
Now, look, as someone who has lost loved ones to cancer, my perspective is that even one case is too many. But this graph of incidence from 2001 to 2021 just doesn’t show an urgent need for a radical new approach. Incidence rates in kids have stabilized and maybe even gone down! What we should probably be doing is making sure we know why this decrease happened so that we can make sure it keeps happening.
American Youth face a Mental Health Crisis
If you want to know about the mental health of American youth, the best place to look is the CDC’s Youth Risk Behavior Surveillance System (YRBSS). This bi-annual (every 2 years) survey monitors mental health and risky behaviors in high school students. The most recent report, available on the landing page of YRBSS, is the 2013-2023 Trends Report.
It paints a picture which is troubling but also hopeful. Indicators like sexual risk behaviors and substance use are improving, as is the percent of students experiencing bullying at school. But other indicators have been getting worse, most notably experiences of violence, persistent sadness or hopelessness, and suicidal thoughts and behaviors. Plus, kids are less frequently engaging in protective sexual behaviors, like use of birth control.
The MAHA Report specifically focuses on mental health, and the YRBSS report has a section dedicated to summarizing the changes in mental health and suicidal thoughts and behaviors over the past 10 years.
The summary of mental health in the YRBSS report says “Nearly all indicators of poor mental health and suicidal thoughts and behaviors worsened from 2013 to 2023.” And the summary image does suggest overall worsening trends since 2013. But on the other hand, most indicators actually remained constant between 2021 and 2023 and the percentage having experienced persistent feelings of sadness or hopelessness actually started to improve in the most recent data.
Overall, what’s going on with youth mental health seems to be much more complex than can be captured in 5 bullet points (which is all the MAHA Report dedicates to describing it).

Allergies are Widespread, and Autoimmune Disorders are Rising
The last category of chronic disease in this report is allergies and autoimmune disorders (autoimmune disorders would normally include Type 1 diabetes, but I assume this is “autoimmune diseases other than Type 1 diabetes”).
Allergies are a growing problem in Americans of all ages. The CDC says almost 1 in 3 (31.8%) adults and over 1 in 4 (27.2%) children had a seasonal allergy, eczema, or food allergy in 2021.
But most of that is seasonal allergies: 25.7% of adults have a seasonal allergy, and so do 18.9% of kids. Eczema is the next most common problem with 7.3% of adults and 10.8% of kids reporting eczema.
Food allergies, on the other hand, only occur in 6.2% of adults and 5.8% of kids. Which is a lot of people. But maybe not the shockingly high numbers RFK Jr likes to make it out to be?
Allergies are something that generally require specialist care to diagnose. Unfortunately, the number of allergy/immunology physicians is not really keeping up with demand. A 2007 study in the Journal of Allergy and Clinical Immunology concluded that the rate of new trainees in allergy and immunology was “inadequate to ensure continued access to A/I physicians throughout the country.” So it’s also possible that these numbers aren’t even all that accurate.
Lastly, what’s going on with autoimmune diseases in children? This is harder data to find. Even if we look back at the National Health Interview Survey data from yesterday there’s not very much information there.
In fact, the question about autoimmune diseases seems to have only been asked in 2022-2023 and includes Type 1 diabetes. If you look at the 2021-2022 data, for example, you’ll see that the autoimmune disease question is replaced by a question about arthritis.
So it’s hard to know what the trends over time in childhood autoimmune diseases, but even when we include Type 1 diabetes, the proportion of children with autoimmune diseases in 2022-2023 was maybe 1%.
Since diabetes is already a focus area, I’m not at all sure why autoimmune diseases are getting special mention, except for the fact that RFK Jr is obsessed with eating weird things.
Okay, that’s all for today. For those of you reading along in the report, we’ve now made it through the first 15 pages. Hopefully, you’ve learned some interesting things about childhood chronic disease and about the freely accessible data on disease collected and distributed by the CDC.
Next time, we’ll examine what the Report calls the “four major drivers” of childhood chronic disease. Which means we’ll get to talk about my favorite part of epidemiology: causal inference! That is, how do we know whether something causes something else. It’s not easy to do, and the good money is on the Report having done some silly things here.
Today’s tl;dr:
Yes, chronic diseases in children have increased over the past several decades, but that increase is potentially starting to level off and, for some diseases, we might even be seeing improvements.
As an independent epidemiologist, I make my living entirely through reader support. Readers like you make E is for Epi possible. Thank you to all the paid subscribers. If you find value in this work, consider becoming a paid subscriber too!
Reminder: I downloaded the MAHA Report from the government’s website on June 1 at 10:49am. They occasionally revise and repost the Report, so, there’s a possibility things I discuss here will have been changed or removed from any version of the Report you go download later.
We will likely see increases in type 1 doabet s once they have all the data from the Covid years- infection widely reported to trigger type 1 in some children.
But RFK JR won’t want to talk about that